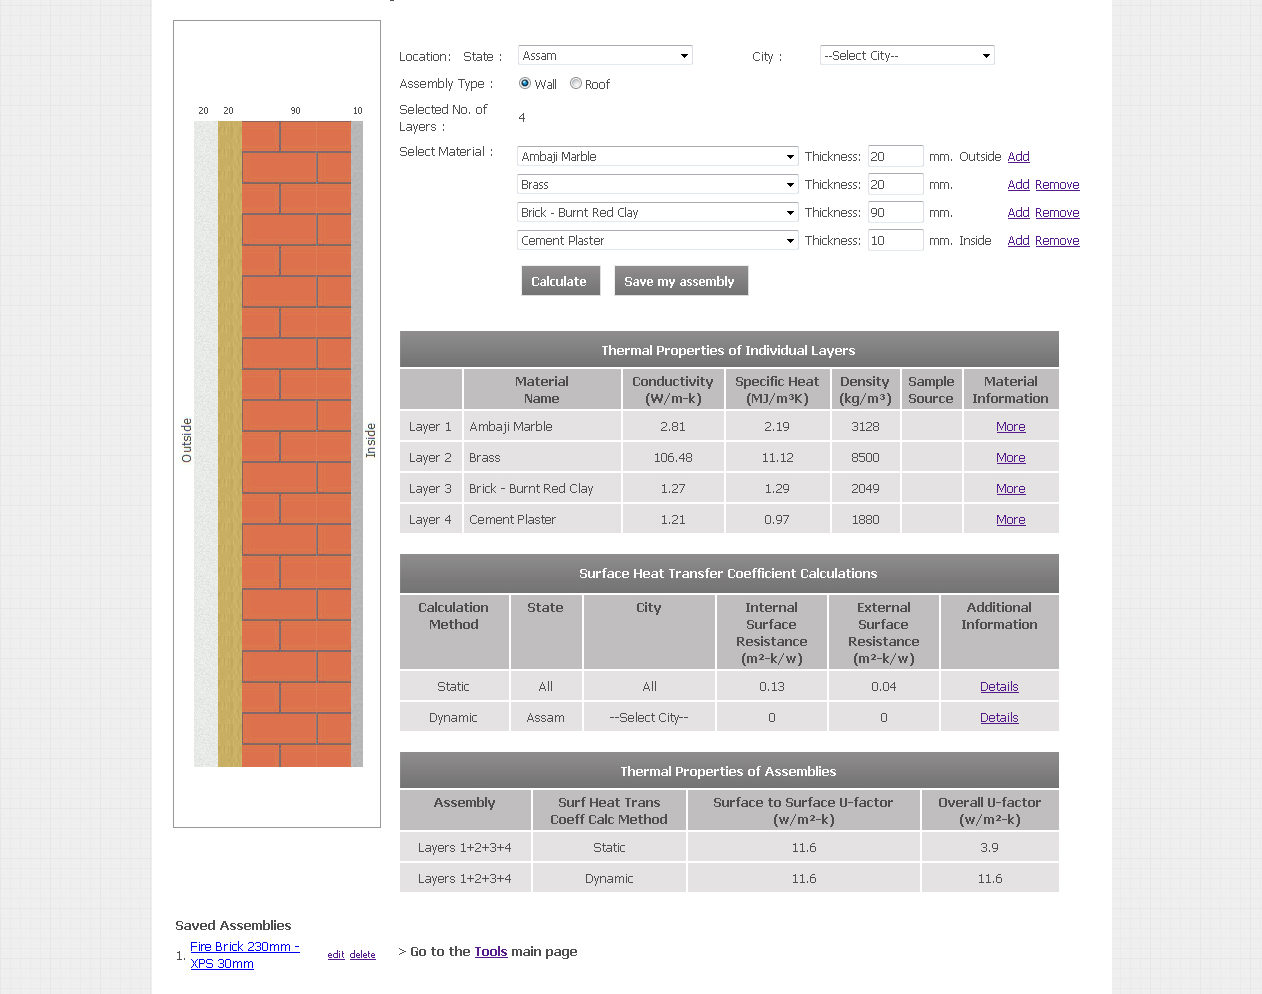
Centre for Advanced Research in Building Science and Energy (CARBSE) at CEPT University has developed a wall and roof construction thermal transmittance or thermal Conductance (U - Factor) calculator.
This is an online tool, to be accessed freely over internet. The values derived by the tool are specific for the city.
Thermal properties of materials used by the tool are derived by extensive characterization of generic construction materials available in various parts of India at CARBSE, CEPT University.
The tool can be useful for selection of building material, construction, for building energy modelling and analysis as well as for code compliance.
This tool is supported by Ministry of New and Renewable Energy Govt. of India and Shakti Sustainable Energy Foundation, New Delhi.
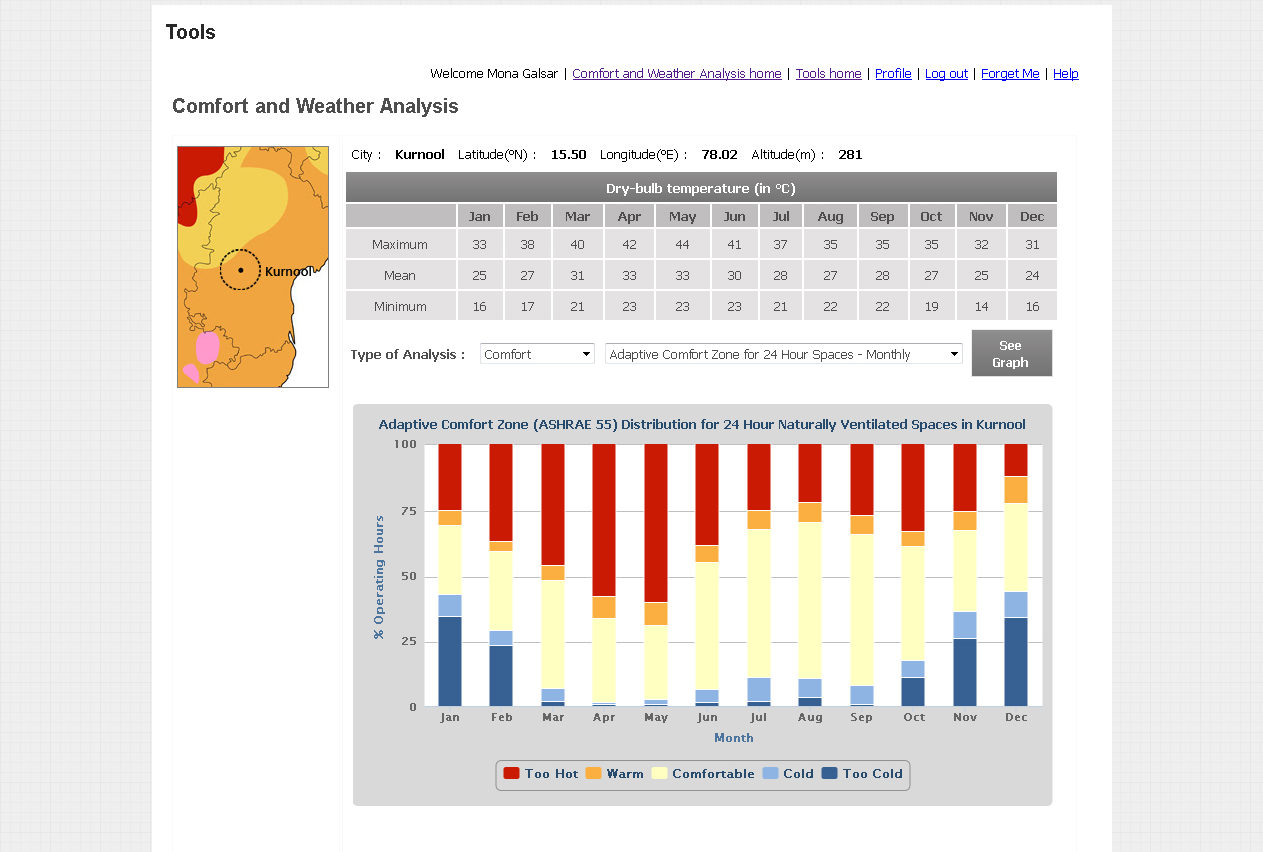
Centre for Advanced Research in Building Science and Energy (CARBSE) at CEPT University has developed a ‘Comfort and Weather Analysis’ tool.
This is an online tool which can be accessed freely over internet.
The tool has been designed to help the user generate thermal comfort and outdoor weather analysis for Indian cities.
The tool efficiently produces the following information:
• Comfort charts showing the temperature of the city for the whole year on the AHSRAE 55 thermal comfort bands.
• ASHRAE 55 comfort zone distribution on 24 x 7 basis for a year and also daytime basis for the city selected by the user. The user can hence determine the number of operating hours that belong to comfort zone for a particular month.
• This tool also develops the weather chart which shows the temperature distribution for 24 x 7 basis and also daytime basis for the city selected by the user.
• The humidity distribution in for 24 x 7 spaces and daytime spaces for the user selected city will also be shown.
This tool is supported by Ministry of New and Renewable Energy Govt. of India and Shakti Sustainable Energy Foundation, New Delhi.
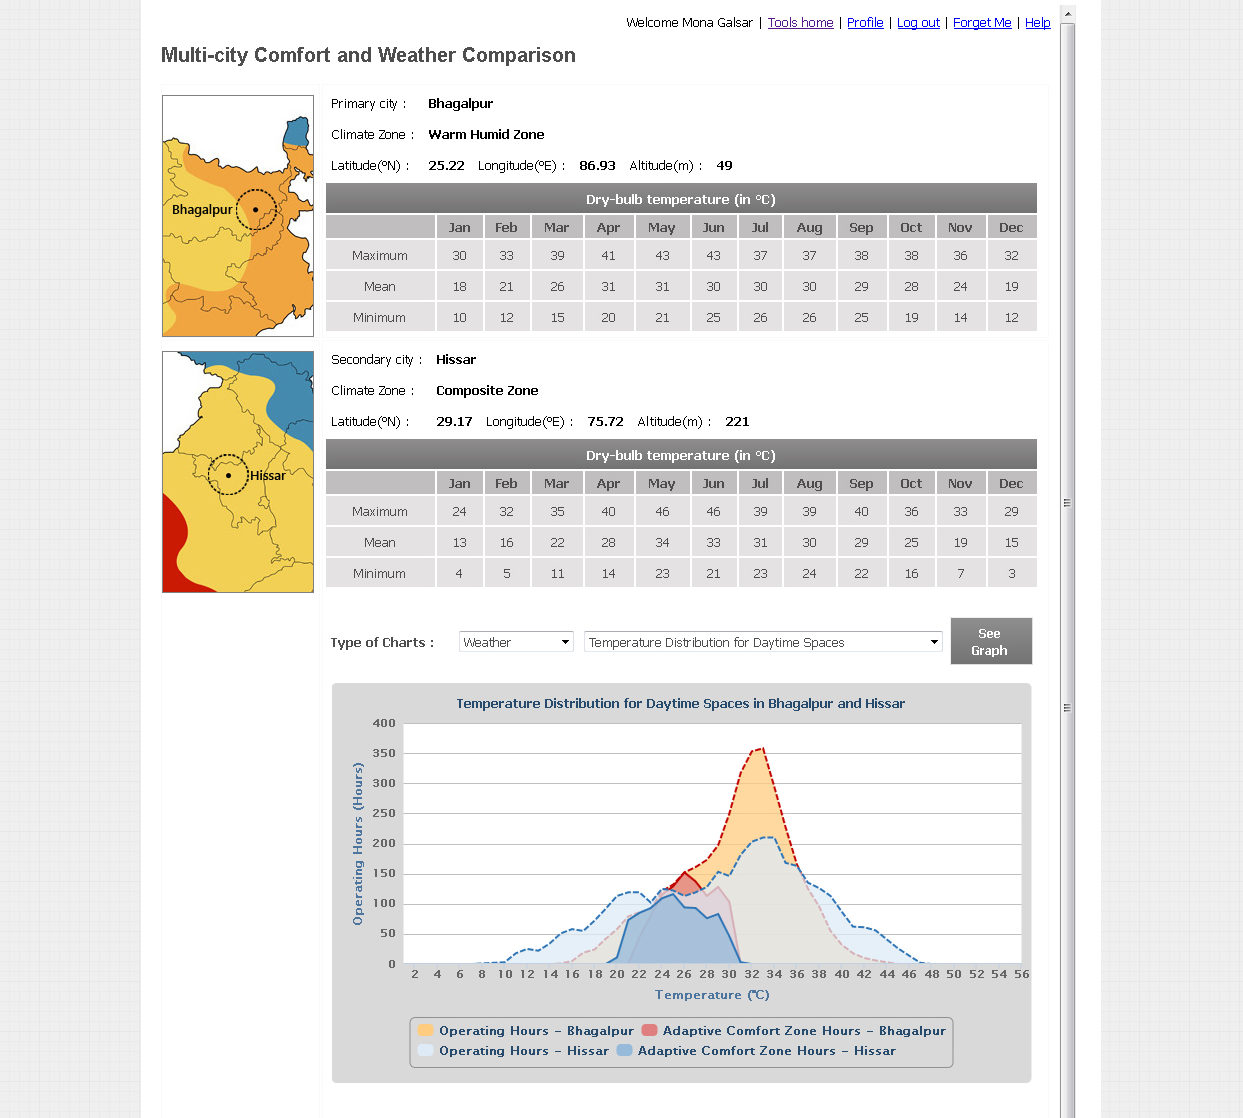
Centre for Advanced Research in Building Science and Energy (CARBSE) at CEPT University has developed a ‘Multi-city Comfort and Weather Analysis’ tool.
This is an online tool, to be accessed freely over internet.
The tool has been designed to help the user generate thermal comfort and outdoor weather analysis and compare results for two Indian cities simultaneously.
The tool efficiently produces the following information:
• Comfort charts showing the temperature of the city for the whole year on the AHSRAE 55 thermal comfort bands.
• ASHRAE 55 comfort zone distribution on 24 x 7 basis for a year and also daytime basis for the city selected by the user. The user can hence determine the number of operating hours that belong to comfort zone for a particular month.
• This tool also develops the weather chart which shows the temperature distribution for 24 x 7 basis and also daytime basis for the city selected by the user.
• The humidity distribution in for 24 x 7 spaces and daytime spaces for the user selected city will also be shown.
This tool is supported by Ministry of New and Renewable Energy Govt. of India and Shakti Sustainable Energy Foundation, New Delhi.
Standard based on an adaptive thermal comfort model can play a major role in reducing energy use whilst maintaining the comfort, productivity and well-being of occupants. This approach recognizes that people’s thermal comfort needs depend on their past and present context and that these needs vary with the outdoor environmental conditions of their location. People’s thermal perceptions – preferences as well as tolerances – are likely to extend over a wider range of temperatures. It allows buildings to operate within broader temperature bands. Theories deals with adaptive thermal comfort model which differentiate the thermal response of occupants in air conditioned and naturally ventilated buildings. Operative temperature is more suitable index to measure thermal comfort in the building having low indoor air velocities, since the index also accounts for impact of building surface temperatures (radiant temperatures) on human comfort. The Indian Adaptive Thermal Comfort Model (IMAC) study models for neutral temperatures and acceptability limits for air-conditioned, naturally ventilated, and mixed mode buildings, as derived through an empirical field study specific to the Indian context, offer an energy efficient pathway for its commercial building sector without compromising occupant comfort. The tool can be useful to determine temperature set points for different types of commercial buildings such as- Naturally ventilated buildings, Mix mode buildings and Air-conditioned buildings. The tool has reference comfort conditions range derived as per adaptive model for Indian cities. These are indicative simplified values using weather files. The tool has inbuilt temperature data for 59 cities of India for which 90% acceptability can be extracted selecting the desired city name. The tool also provides the flexibility to tool users for annual hourly temperature input of any other specific location (as and where required) and hence 90% acceptability results for that city. This tool is supported by Ministry of New and Renewable Energy Govt. of India. New Delhi.

Buildings consume 40% of the total energy generated globally. A significant proportion of this consumption is utilized in order to maintain comfortable indoor temperatures via cooling or heating. A building can be classified as being in one of the three ‘Building Operation Modes’ depending on the presence of Air Conditioning. The ‘Natural Ventilation’ mode implies the absence of Air-Conditioning as well as assisted mechanical ventilation; conversely the ‘Air Conditioned’ mode implies that comfort is achieved wholly by the use of artificial mechanisms; the ‘Mixed Mode’ of operations is a combination of the two aforementioned modes, suggesting that Air Conditioning is used over specific spaces or during certain time-periods. Studies have shown that indoor comfort temperatures correlate strongly to outdoor weather conditions. The aim of this tool is to calculate indoor comfort temperatures or ‘Average Neutral Operative Temperatures’ for 160 Indian cities and towns and provide temperature ranges where 90% or 80% of occupants would feel comfortable in a building. This tool calculates these temperatures for commercial as well as residential buildings using a region’s Typical meteorological year (TMY) data. While the commercial building type includes three modes of operations (Naturally Ventilated, Air Conditioned, and Mixed Mode), the residential building type assumes a ‘Mix Mode’ of indoor operations. The tool provides a table with the calculated temperatures and ranges and provides the visualization for the same. A user may download this calculated data output in the form of a *.csv file by using the ‘Download Data’ feature. Please wait for 60-90 seconds to load the following tool.
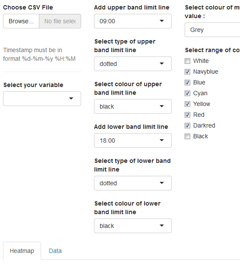
Centre for Advanced Research in Building Science and Energy (CARBSE) at CEPT University has developed two tools to generate heat maps. This is a free tool. Objective of this tool is to help visualize Building Energy Simulation output in more meaningful manner.
Salient feature are:
• Choices of colours to make the heat map including separate colour provision for missing value.
• Choice of different date formats that best suits the timeline.
• Choice to alter the range of numbers to be included in the heat map by adjusting variable scale options.
• Provision to enter the title, X-axis, Y-axis and legend label name.
To use this tool the user’s input CSV file should have
• A column with exact header as “Timestamp”.
• The format of Timestamp should be “decimal date – decimal month – 2 digit year
• Other columns of the input file must contain numerical value and blank cell for missing values.
Heat map Type-1 helps in visualising any one variable at a time which are listed in the input CSV file. The tool can also add a constant time band using upper and lower limit values. The user can dynamically navigate to see the behaviour of other variable from the drop-down menu available.
Heat map Type-2 helps in visualising many variables at the same time which are listed in the input CSV file. The tool also gives a provision to adjust the number of variables that the user want to show on the heat map.
User can download output from this tool as *.PNG file.
The tool is output of project titled US India Joint Centre for Building Energy Research and Development (CBERD) sponsored by The U.S. Department of Energy (DOE) and the Department of Science and Technology (DST), Government of India.
A thermal comfort model is an approach to predict thermal comfort of humans in an indoor space. Predicted Mean Vote (PMV) based model was the first thermal comfort model developed by Fanger in 1970 based on heat balance of the human body dependent on physical parameters and human clothing and activity index.
Another approach to predict thermal comfort is by using an ‘adaptive’ model that has regard for variation in outdoor climate for determining indoor thermal preferences, this can be applied in air-conditioned as well as naturally ventilated buildings. It takes into account people’s perception of their environment change based on seasonal expectations of temperature and humidity as well as their capacity to control the conditions in a space.
Adaptive models of thermal comfort are implemented in various international standards such as ASHRAE Standard 55, European EN 15251 and ISO 7730 standard.
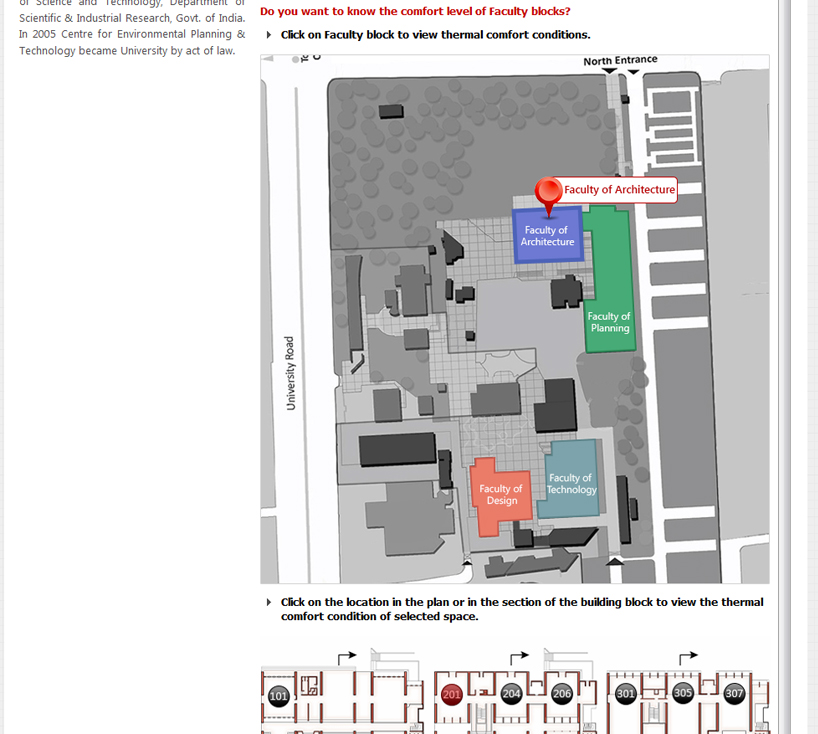
There has been a need for adaptive thermal comfort for India. The India Model for Adaptive (Thermal) Comfort Study (IMAC) has been developed by Centre for Advanced Research in Building Science and Energy (CARBSE) at CEPT University in India. This has helped develop a standard based on an India specific model which would provide design and operation guidance for air-conditioned buildings, naturally ventilated (NV) buildings and mixed mode buildings which are operated in AC and NV mode both. In order to predict thermal comfort within various buildings at CEPT University, CARBSE undertook thermal monitoring of buildings on CEPT campus over a period of one year from March 2015 to February 2016.
The team used state of art hand-held instruments to take measurements. It also installed GSM based Automated weather station to collect outdoor conditions.